Introduction
This is a follow up to my blog post on Bare-metal Rust bootstrapped by C. In this post, I want to discuss how I used the Renode emulator to verify that my setup works. I won’t go into too much detail about how to use Renode. I just want to discuss the part that was relevant for my tests.
Installation
The first step of getting started with Renode is obviously to install it. This is fairly simple, simply go to https://renode.io/#downloads, download the corresponding package for your operating system and install. I won’t bore you with any additional details :)
Aside for WSL users
Something to note here is that if you are on Windows 11 but using WSL like I am, I would recommend you install Renode inside WSL rather than native Windows. Even though communication between the two environments should work, I found it much easier to just have everything inside WSL.
Why my current setup is WSL is a long story which I won’t get into right now, but might in a future post…
Scripting Renode
Renode is a very powerful emulator with a console and a great many options. However, as nice as the console might be, it is very cumbersome to constantly write terminal commands as part of your development workflow. As such, it is much more efficient to set up a script to automate things.
$bin?=@final.elf

# Create the board and load our binary
mach create
machine LoadPlatformDescription @platforms/boards/stm32f4_discovery-kit.repl
sysbus LoadELF $bin

# Start the GDB server
machine StartGdbServer 3333
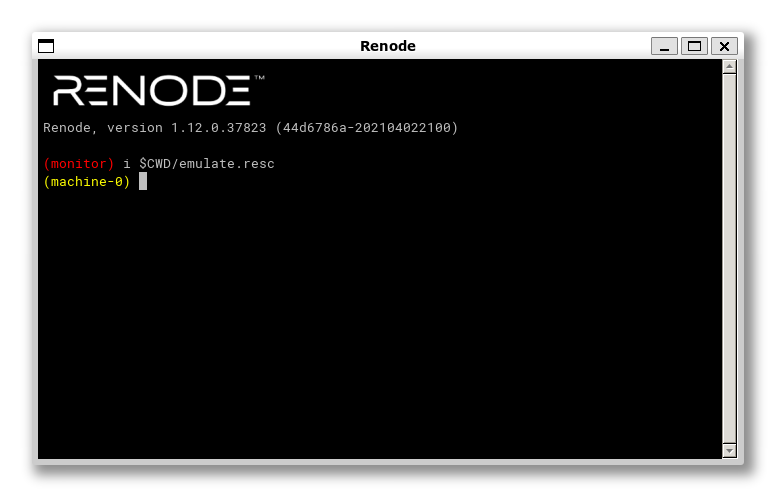
Save the above in a file called e.g. renode emulate.resc and then you can execute the shell command renode emulate.resc which should bring up a Renode window.
Makefile integration
To streamline our workflow even further, we can extend our Makefile to the following:
CC = arm-none-eabi-gcc
MACH = cortex-m4
CFLAGS = -c -mcpu=$(MACH) -mthumb -mfloat-abi=hard -std=gnu11 -O0 -Wall -g
LDFLAGS = -nostdlib -T stm32_ls.ld
RSTARGET = thumbv7em-none-eabihf
RENODE = renode

all: final.elf

stm32_startup.o: src/stm32_startup.c
	$(CC) $(CFLAGS) $^ -o $@

libapp.a: FORCE
	cargo build --target $(RSTARGET)
	cp target/$(RSTARGET)/debug/libapp.a .

final.elf: stm32_startup.o libapp.a
	$(CC) $(LDFLAGS) $^ -o $@

emulate: final.elf
	$(RENODE) emulate.resc

clean:
	rm -rf *.o *.elf *.a
	cargo clean

FORCE:
This means that we can now run make emulate to start the emulator, and automatically rebuild our code if needed.
Connecting GDB to Renode
So being able to start the emulator is all fine and well, but the question right now is how do we use this emulator to test that out code works? The way that I decided for now is simply to connect to it with a debugger and check that breakpoints are hit. In the future, it would be interesting to set up all sorts of automated tests, which Renode is of course very capable of facilitating.
First, you want to ensure that you have gdb-multiarch installed on your system. Then you can get things started by running:
gdb-multiarch final.elf
Inside GDB, you now have to connect to Renode using:
target remote :3333
We now want to set up a breakpoint using e.g.
break lib.rs:10
Finally we can run:
monitor start
continue
And boom, now you should see your breakpoint hit!

Remarks
I use gdb-multiarch instead of regular gdb because I want to debug ARM code on an x86_64 host.
You need to call monitor start before continue to get the Renode machine actually running.
Bonus: Integrating with VSCode
As an editor, I currently use VSCode because uhm why not… Anyway, one of the nice features of VSCode is that you can set up custom integrations quite easily. So here I want to describe how you can set up VSCode to automatically launch the debugger with a connection to Renode.
First, make sure you have the Cortex-Debug extension installed As we will be using it for debugging.
Next, you should modify your launch.json to resemble the following:
{
    "version": "0.2.0",
    "configurations": [
        {
            "name": "Renode Debug",
            "cwd": "${workspaceRoot}",
            "executable": "./final.elf",
            "request": "launch",
            "type": "cortex-debug",
            "servertype": "external",
            "gdbTarget": "localhost:3333",
            "gdbPath": "gdb-multiarch",
            "preLaunchCommands":[
                "monitor start"
            ]
        }
    ]
}
Now, once you have the emulator running with make emulate. You can debug using the “Renode Debug” profile in VSCode. With this, you should now be able to set breakpoints using the IDE and see them being hit as normal.

Remarks
Currently you will have to manually restart the emulator before you can restart debugging. I haven’t spent time figuring out how to make resets work properly. Feel free to leave a comment if you figure this out and feel like sharing.
I have spent a bit of time trying to figure out how to get VSCode to automatically start the emulator when you start the debugger using tasks.json, but I didn’t manage to get it working. Again, if you can figure this out, please feel free to leave a comment.
References
Most of what I have presented here, I learned from Cortex-M MCU Emulation with Renode. My post is much shorter and only contains what I found most relevant. Please read that full post if you want more information on Renode.
I can never remember how to use the GDB CLI, so whenever I get into a situation like this where I have to, I like to use a “cheat sheet” such as the nice one available on GDB Cheat Sheet.